

A Little Known Strategy to Dollar Cost Average
How to Dollar cost average (DCA) at Different Value Points?


What is Dollar Cost Average?
Dollar cost average (DCA) involves investing the same amount of money (usually small amounts) in the same stock on a regular basis over time.
Dollar cost average has been proven to be one of the easiest and most profitable strategies. It allows us to gradually build up a position in a stock and removes the ONE major obstacle that sabotages our investment returns:
Human Emotions.
The Inventor
Before I introduce the strategy, let me introduce you to the man behind it. His name is Tom Engle. He is one of the best investors that the world has never heard of, and a legend in the Motley Fool Stock Advisor investment community in the U.S. Tom provides a framework that helps us to buy stocks at better valuations over time.
A phrase from Tom that I resonate with:
“If it works out, a little is all you need; if it doesn’t, a little is all you want.”
Building a Position Using Value Points
Let’s say we want to build a position in FB from scratch.
Here's the step-by-step process on how we would do it.
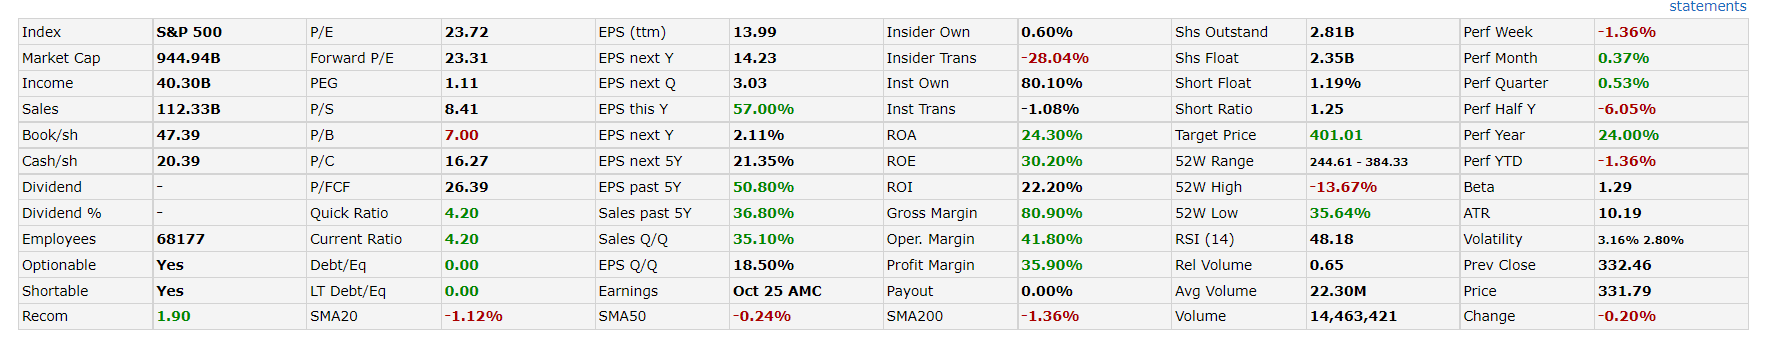
1) Search for the ticker symbol in Finviz.

2) Open the excel spreadsheet below.
3) Building our position in $1,000 increments.
The current stock price of FB is $331.79. With $1,000, we can buy 3 shares. This will be our first tranche.
Note that it doesn’t have to be $1,000, it can be $500 or $2,000 or anything you are comfortable with investing on a periodic basis.
4) Fill in the spreadsheet based on the information from Finviz.
Ticker: FB
Date: 9 Jan 2022
Price: $331.79
Shares: 3
P/E: 23.72
Forward P/E: 23.31
P/S: 8.41
Dividend yield: 0% (We’ll ignore dividend yield in this case as company does not pay a dividend)
5) Wait for the next quarter when the company announces earnings
If our investment thesis of the company is intact, AND we have capital to invest, we will enter our second tranche.
We want to add at a BETTER VALUE than our first tranche.
This DOES NOT necessarily mean that the stock price has to be LOWER.
What we are looking for is:
P/E < 23.72
Forward P/E <23.31
P/S <8.41
Now, you may ask. How is the company representing better value when the share price is up?
There are 2 possibilities:
a) FB financials improved and share price increase.
b) FB financials improved and share price decrease.
6) Buy the stock at better valuations over time, even if this means paying a higher stock price.
On ONE condition:
The revenue, net income, cash flows of the company are growing faster than the share price.
Even though they are not perfect, financial ratios such as P/E, forward P/E, P/S and dividend yield will give us an estimate of a company’s valuation.
7) There are some exceptions.
Some incredible stocks like TSLA are doing so well that we might have to add at worse value points, but that’s okay if:
The business is crushing expectations.
The story has a major positive change (like beneficiaries of Covid-19)
Why use this system?
This system might look and sound simple (and it is!), but it will hugely benefit many investors. It allows us to steadily build a position in the company, and our knowledge of the business grows over time.
Summary
1) Search for the ticker symbol in Finviz.
2) Open the excel spreadsheet.
3) Building our position in $1,000 increments (or whatever amount you decide).
4) Fill in the spreadsheet based on the information from Finviz.
5) Wait for the next quarter when the company announces earnings.
6) Buy the stock at better valuations over time, even if this means paying a higher stock price.
7) Exceptions like adding on at worse value points for incredible companies.
P.S If you enjoyed this, please share the love by sharing with your family and friends.